

We had another great week of trading this past week. As I mentioned in last week’s recap, the price action and sentiment point to signs that liquidity is coming back into small caps.
Textbook A+ Black Swan Trade & Last Week's Action

It feels like the small cap market woke up last week. Obviously, we all saw the craziness of VVOS and the kind of activity it inspired. I took away a lot of different lessons from last week, and I wanted to share them here by reviewing 3 runners. But before I dig into the runners, I want to take a quick look at the cycle in general.
This week, I have some even better data to confirm this: Weekly dollar volume inflows into small caps have crossed the $1B threshold on a daily basis.
Let’s compare and contrast between these last two weeks.

11/29 saw a huge influx of dollar volume. If you recall, that was the day VVOS squeezed from 12 to 48, and ended up doing close to $600M dollar volume that day.
This last week saw even more dollar volume inflows:
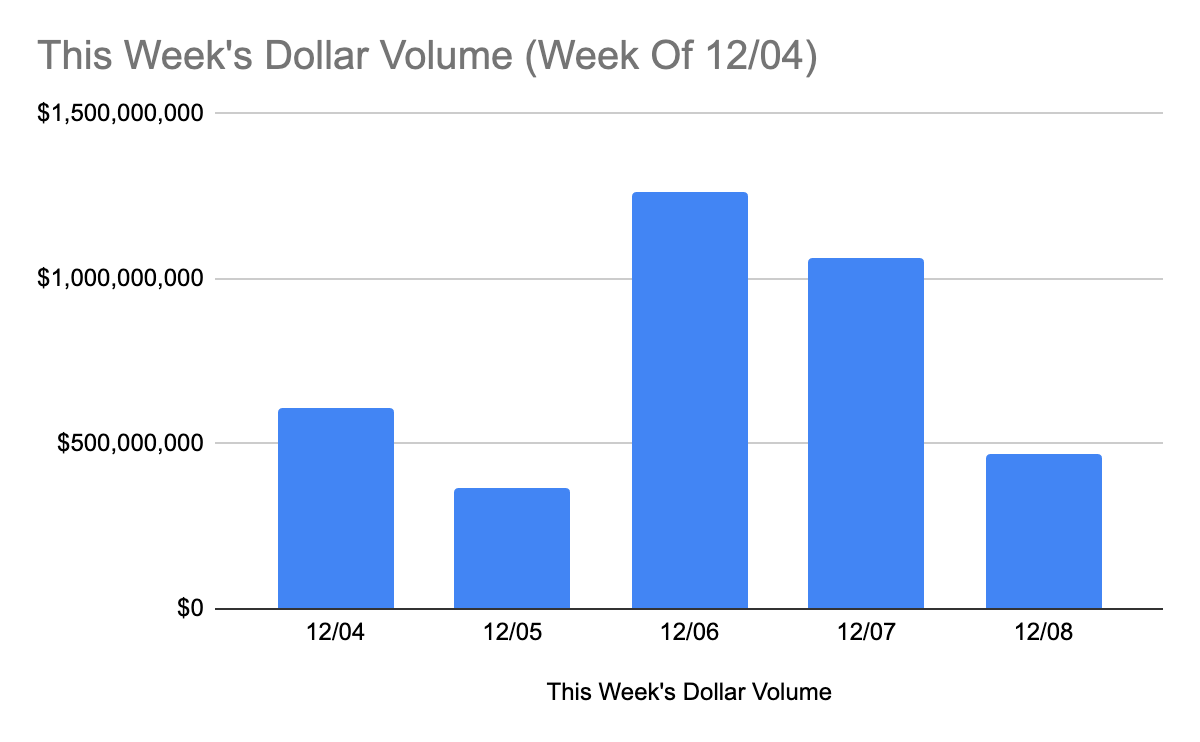
This last Wednesday crossed the $1B dollar volume threshold with MLGO taking up the bulk of the amount with $439M. Other noticeable runners:
ALT
Ran 33% from open to high
Closed with $352M dollar volume
SERA
Ran 96.81% from open to high
Closed with $450M dollar volume
Interesting catalyst where the Data Safety Monitoring Board recommended SERA to stop enrollment for their study due to efficacy
SERA had a fascinating catalyst that I’ll get into in the deep dive.
But the overall point is to show that dollar volume is increasing, which means more commitment from market participants. When this occurs, expect larger range moves both on the long and short sides. In other words, more opportunity.
Another point is the pattern of dollar volume inflows ebbing and flowing across the week. Both this week and last week saw lower amounts of participation on Mondays and Tuesdays, activity picking up on Wednesday and Thursday, and Fridays being the slowest day of the week so far.
SERA 12/06

I purposefully zoomed out on this SERA chart because I want to highlight how abnormal the daily chart looks.
It does not resemble your average small cap pump and dump chart. Sure, the stock has sold off a lot since early February, but it doesn’t stink like a company that needs to raise cash by diluting shareholders.
SERA does have warrants, but they’re not registered, and they don’t have any S-1’s or S-3’s. From a dilution perspective this is great, because the fundamentals align with the chart.
Some more high-level stats that you would know in the premarket:
Float: 29.35M
Gap: 138.57%
8M shares traded in the premarket
Combining these stats with the fundamental stats gives a pretty decent idea for a long. The only negative would be the 138% gap, but some of these big gappers have been working lately:
RDHL 11/27 gapped 123%
VVOS 11/29 gapped 170%
SSNT 12/04 gapped 156%
Of course this doesn’t mean to blindly buy any stock that’s gapped over 100%, but simply means to be flexible to the idea that stocks like these could still put another leg up.
Catalyst
Moving onto the catalyst of SERA stopping enrollment due to efficacy appears significant. The key phrase can be found in the opening paragraph of the PR:
…the Data Safety Monitoring Board (DSMB)…recommended stopping enrollment due to efficacy, reporting that either of the co-primary endpoints met the stopping criteria for statistical significance at the pre-planned interim analysis.
In other words, the initial data from the study is so powerful that it erases beyond a shadow of doubt that it works. Now the company can get to work analyzing the data further:
The Company has adopted the DSMB's recommendation and will stop PRIME study enrollment to focus on analyzing and reporting the available data.
This adds more conviction to the long thesis.
Finding A Trade
The one trade idea in SERA that did not require buying the breakout (I absolutely detest buying the breakout unless the market cycle gives obvious evidence otherwise) was a dip off the previous 52-week high’s at 4.25.

The only way you would have got into this trade is if you set your limit orders down near 4.25, and you would have been in the money right away as it wicked down and reclaimed VWAP.
With hindsight, you would probably partial out your shares starting at 6.00 and trail out the remainder on the way up.

The first sell is the easiest, and the last few sells can be more difficult, because you don’t know exactly how high the stock will go. It can be easy to kick yourself for selling too soon.
However, one way to lock in more profits is to sell your last few shares into weakness.
One way to identify this is failure at a whole number. SERA failed to reach the 10.00 whole number 3 separate times. This is a great place to sell, and even if the stock goes up higher, you still had a concrete reason to exit your position.
Consolidation

The morning consolidation is a great study because it led to such a big move. Some of the things that stand out to me are:
It pushed and failed to take out premarket high’s
The volume dried up dramatically starting at 9:39
The huge swipe both up and down at 9:44
How quiet and tight the consolidation became after the swipe
What are some of the supply and demand characteristics that might apply to the next stock in play?
One thing is to note the general structure including the premarket. As I do this more and more often, I’m noticing there’s a bigger story at play. I used to disregard the premarket price action, but I’m finding it can foreshadow moves into the open.
In SERA’s case, the stock had made a big move in the premarket off the PR. It still looks very much frontside, even with the selling off the open.
As the day played out, the bigger picture price structure became clear: SERA made its first leg in the premarket, consolidated off the open, and pushed for a second leg higher.
It wasn’t that easy to read though. The huge downwick made things very scary.
Undoubtedly a lot of longs and shorts got trapped and stopped out, but notice that it respects the 4.25 level and reclaims VWAP immediately. The real tell is being fast enough to notice the change in character afterwards.
Notice how tight and narrow the candles become. Aside from one last little shakeout down to 5.00, it seems like activity in SERA completely dried up.
It then consolidates quietly on low volume before blasting to 9.86. Low volume is not always present in consolidations, but something I’m noticing in the mega consolidations on VVOS and MLGO is how they typically decrease in volume the longer it goes on.
Takeaways
Look for the bigger picture, as this carries more weight
What looked like random choppiness off the open became price consolidating and setting up for a second leg higher
Distinct change in character after the swipe candle
Low volume can be a check in your favor but isn’t always required
MLGO 12/06
It’s now been two Wednesday’s in a row that’s produced a major short squeeze.
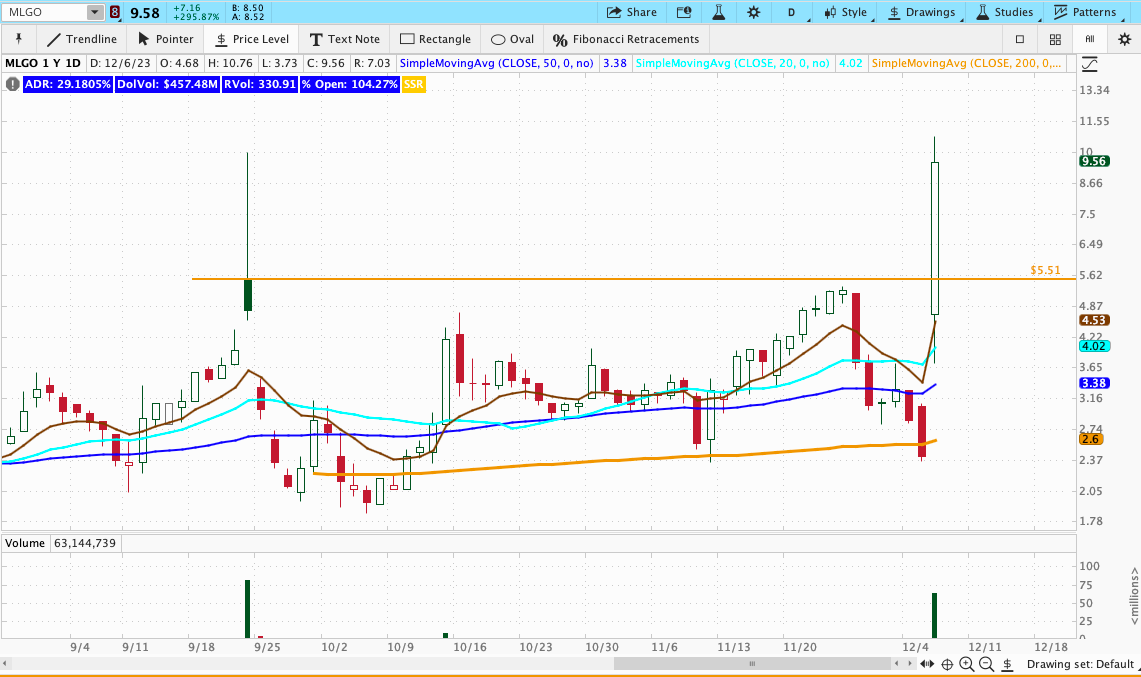
Basic stats:
Gaps up 71% from 2.42 to 4.13
Very unconvincing catalyst that it plans to establish a postgraduate training program
3.96M float
8M shares traded premarket
What was the easiest trade you could have taken this day, noticing the 5.51 level from the chart above?

Notice where the first consolidation on the left finds resistance at: the 5.51 level drawn from the daily chart (scroll up). The stock actually penetrates slightly above to 5.64, and this provides a great spot to get long at for a continuation move and end of day squeeze.
You would want to be a little more patient with this kind of setup. You suspect that 5.64 could be the level, but you want some confirmation it’ll hold.
Why?
Because there’s a chance you’re on the backside. The stock has made a big move from 4.68 to 6.80 and could be done for. When you’re on the frontside, you can be much more aggressive with buying dips, but when it’s unclear, you need a little extra confirmation.
You end up getting a high quality shakeout bar at 12:42PM. This is all the confirmation you need to get long. You can risk off its low, buying off a break of prior bar high’s.
If you were closely tracking the cycle, you might have used VVOS as a precedent and tried to hold for as long as you could.

Sells at 8 and 9 would have been reasonable, and to be defensive, you would have had to exit everything once you saw it fail at 9.50 and break the 8.35 shelf.
There’s a good chance that the move to 9.50 was the move that everyone was waiting for, and holding on past that seems greedy because it doesn’t always recover. It just as easily could have kept rolling over into 6.00.
Takeaways
Track the market cycle and previous runners
If you saw VVOS last week and observed its consolidation, you would’ve had much more conviction in getting long a similar consolidation in MLGO
Sometimes the worst, most unconvincing PR’s are the best squeeze material.
The company may need to issue something, even if it’s absolute garbage to pump the stock without getting hit with a T12 halt
Use the daily levels from previous high volume events to generate trade ideas
Conclusion
The pattern of slow Mondays and Tuesdays, explosive Wednesdays and Thursdays, and lagging Friday’s has become clear. I would look for another week of similar activity heading into next week, but always be flexible for a break in the pattern and trade what the market gives you.
With dollar volume reaching relative high’s, it’s possible a slower week is on the horizon to digest some of the recent activity. However, I think more likely than not we see a continuation of this kind of range and volatility.
We’re definitely headed in the right direction for a strong cycle, but one criteria still unfilfilled is a concrete theme like EV, AI, or marijuana.
One potential theme to keep in mind is the Bitcoin sector, now that BTC has crossed the 40,000 mark.
Dollar Volume Statistics
Average dollar volume: $190M (28% increase week over week)
Median dollar volume: $183M (74% increase week over week)
Again, for those new to my Substack, I track small cap stocks to gauge market sentiment. I define a stock that influences market sentiment as:
A stock > $1 with over 10M shares traded by EOD
A stock < $1 with over 20M shares traded by EOD